DeepPhe Visualizer user guide
The DeepPhe Visualizer helps you find groups of patients whose clinical records match selected demographic, cancer, staging, pathology, biomarker, and treatment criteria — and then trace any finding back to the note it came from.
Most work happens in the Cohort Explorer, the screen that opens when you start the application.
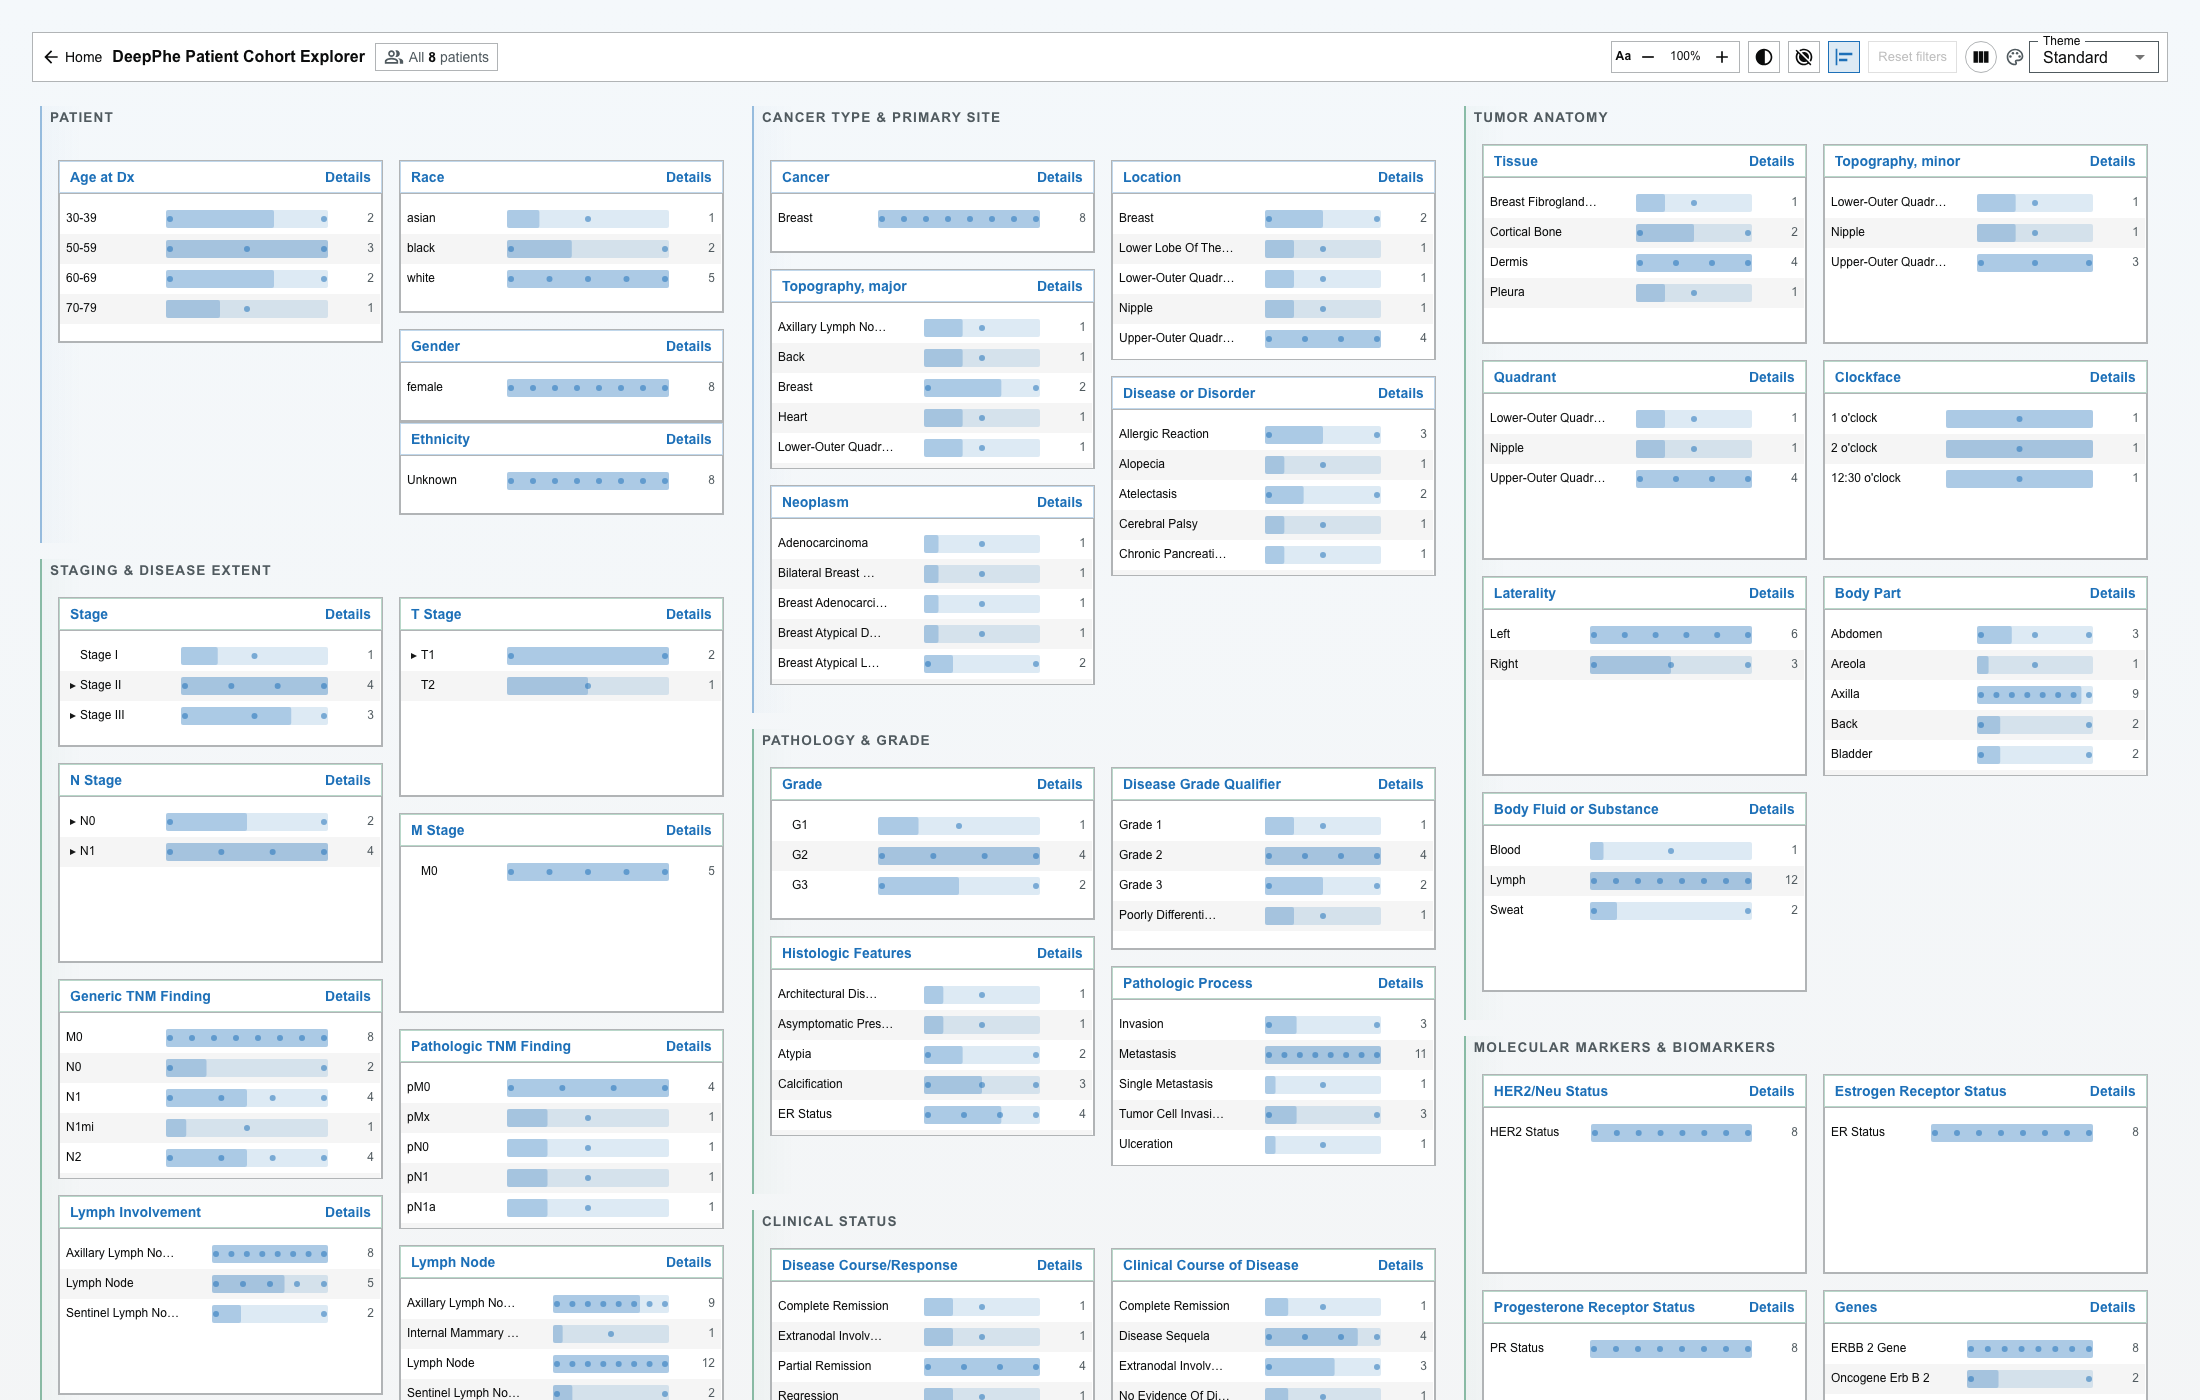
Start here
New to the Visualizer? Begin with Cohort Explorer overview and Build your first cohort.
After you understand the Cohort Explorer, patient results, and patient views, use the guided workflows to practice real review and research questions:
- Validate Stage IV Metastatic Evidence — narrow a Stage IV metastatic cohort to contrasting patient records and trace the evidence
- Build a HER2-Targeted Therapy Cohort — assemble a HER2-drug group, check its biomarkers, and export it
- Compare Responders and Progressors — hold complete responders against progressors
What you can do
The guide follows the tasks you do, in order:
- Build a cohort — choose and combine clinical filter values and watch the matching patient count update.
- Review patient results — read the counts, open the Selected Patients drawer, and inspect, search, sort, and expand patient rows.
- Explore a patient — open one patient to see their cancer and tumor detail, document timeline, structured Patient Summary, and the Document Viewer, and follow any finding to its source note.
To adjust appearance or accessibility, see Customize & Accessibility. For quick answers, see Troubleshooting or the one-page Printable guide.
Visualizer results combine structured data with clinical concepts extracted from notes by natural-language processing. Both can be incomplete or imperfect. Confirm important findings against the source medical record and your organization's review procedures. An absent value is not a confirmed negative clinical finding.