Screen overview and toolbar
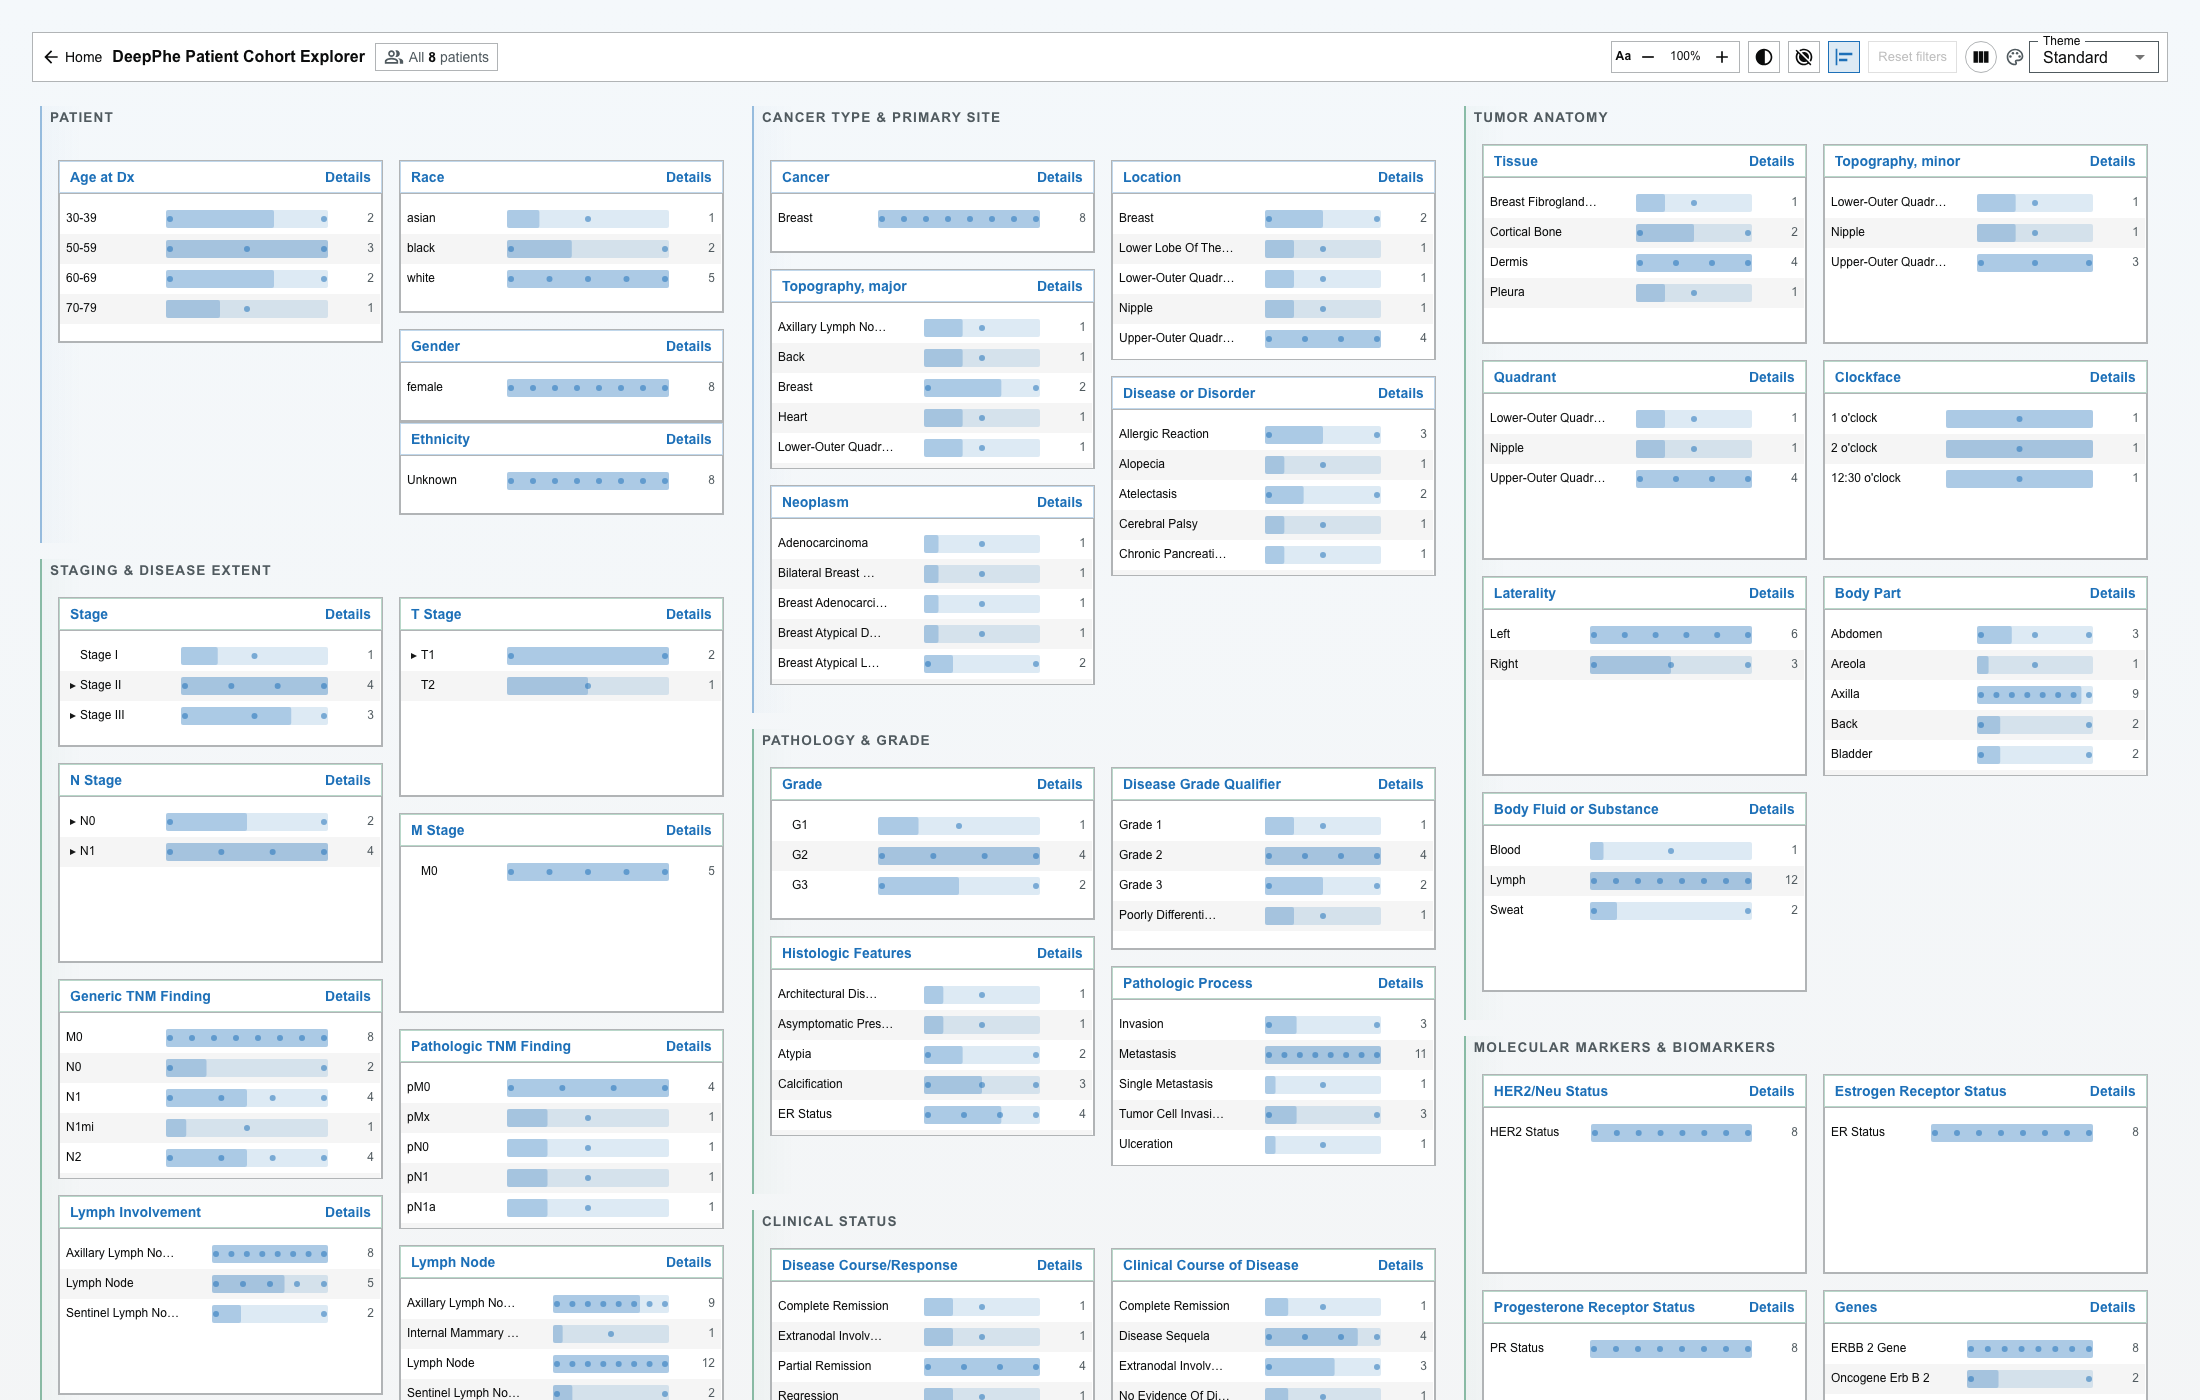
Toolbar
The toolbar stays near the top of the screen as you scroll.
Patient count
Beside the title, a running count tells you the size of your cohort:
- Before you select anything, it reads All N patients — the whole dataset.
- After you select filters, it reads N of total patients selected.
- While a new result is being calculated, the count dims to show it is updating, then brightens when the new number is ready.
Controls
| Control | What it does | Changes the cohort? |
|---|---|---|
| Home | Returns to the landing page, with links to the Cohort Explorer, the standalone Patient View, and the Accessibility Statement. | No |
| Aa − / + | Decreases or increases the interface font size. | No |
| High contrast | Strengthens foreground and boundary contrast. | No |
| Reduced motion | Minimizes animation and transitions. | No |
| Bars behind dots | Adds a faint proportional bar behind patient dots while keeping the dots dominant. | No |
| Reset filters | Clears all filter selections and related view state. See what Reset filters does. | Yes — clears it |
| Layout toggle | Switches between one card per column and a stacked flow layout. | No |
| Theme | Chooses a supplied theme (Standard, Obsidian, Vapor) or opens the Theme Builder. See Theme and Theme Builder. | No |
Only Reset filters affects your cohort. Everything else changes appearance or accessibility.
Your browser stores these display preferences between visits: theme, Theme Builder color changes, font size, high contrast, reduced motion, and the bars-behind-dots setting. The layout toggle is not stored — it returns to its default when you reload the page.
Filter sections
Cards are grouped by subject. Common sections include:
- Patient
- Cancer Type & Primary Site
- Tumor Anatomy
- Staging & Disease Extent
- Pathology & Grade
- Molecular Markers & Biomarkers
- Clinical Status
- Treatment & Interventions
Only sections present in the current dataset appear. See Filter categories.
Filter cards
Each card shows the filter name, its values, a bar for relative frequency, and a patient count per value. A long card scrolls internally so it never pushes the rest of the page down. Select the card header (Details) to open a larger, searchable, sortable list — see Filter Details dialog.
Selected Patients drawer
The drawer appears when a result is available. You can minimize it to a summary, restore it, maximize it, and switch between the cohort table and any open patient tabs. Press Escape to leave the maximized state or collapse an expanded drawer. See Selected Patients drawer.