Cohort Explorer overview
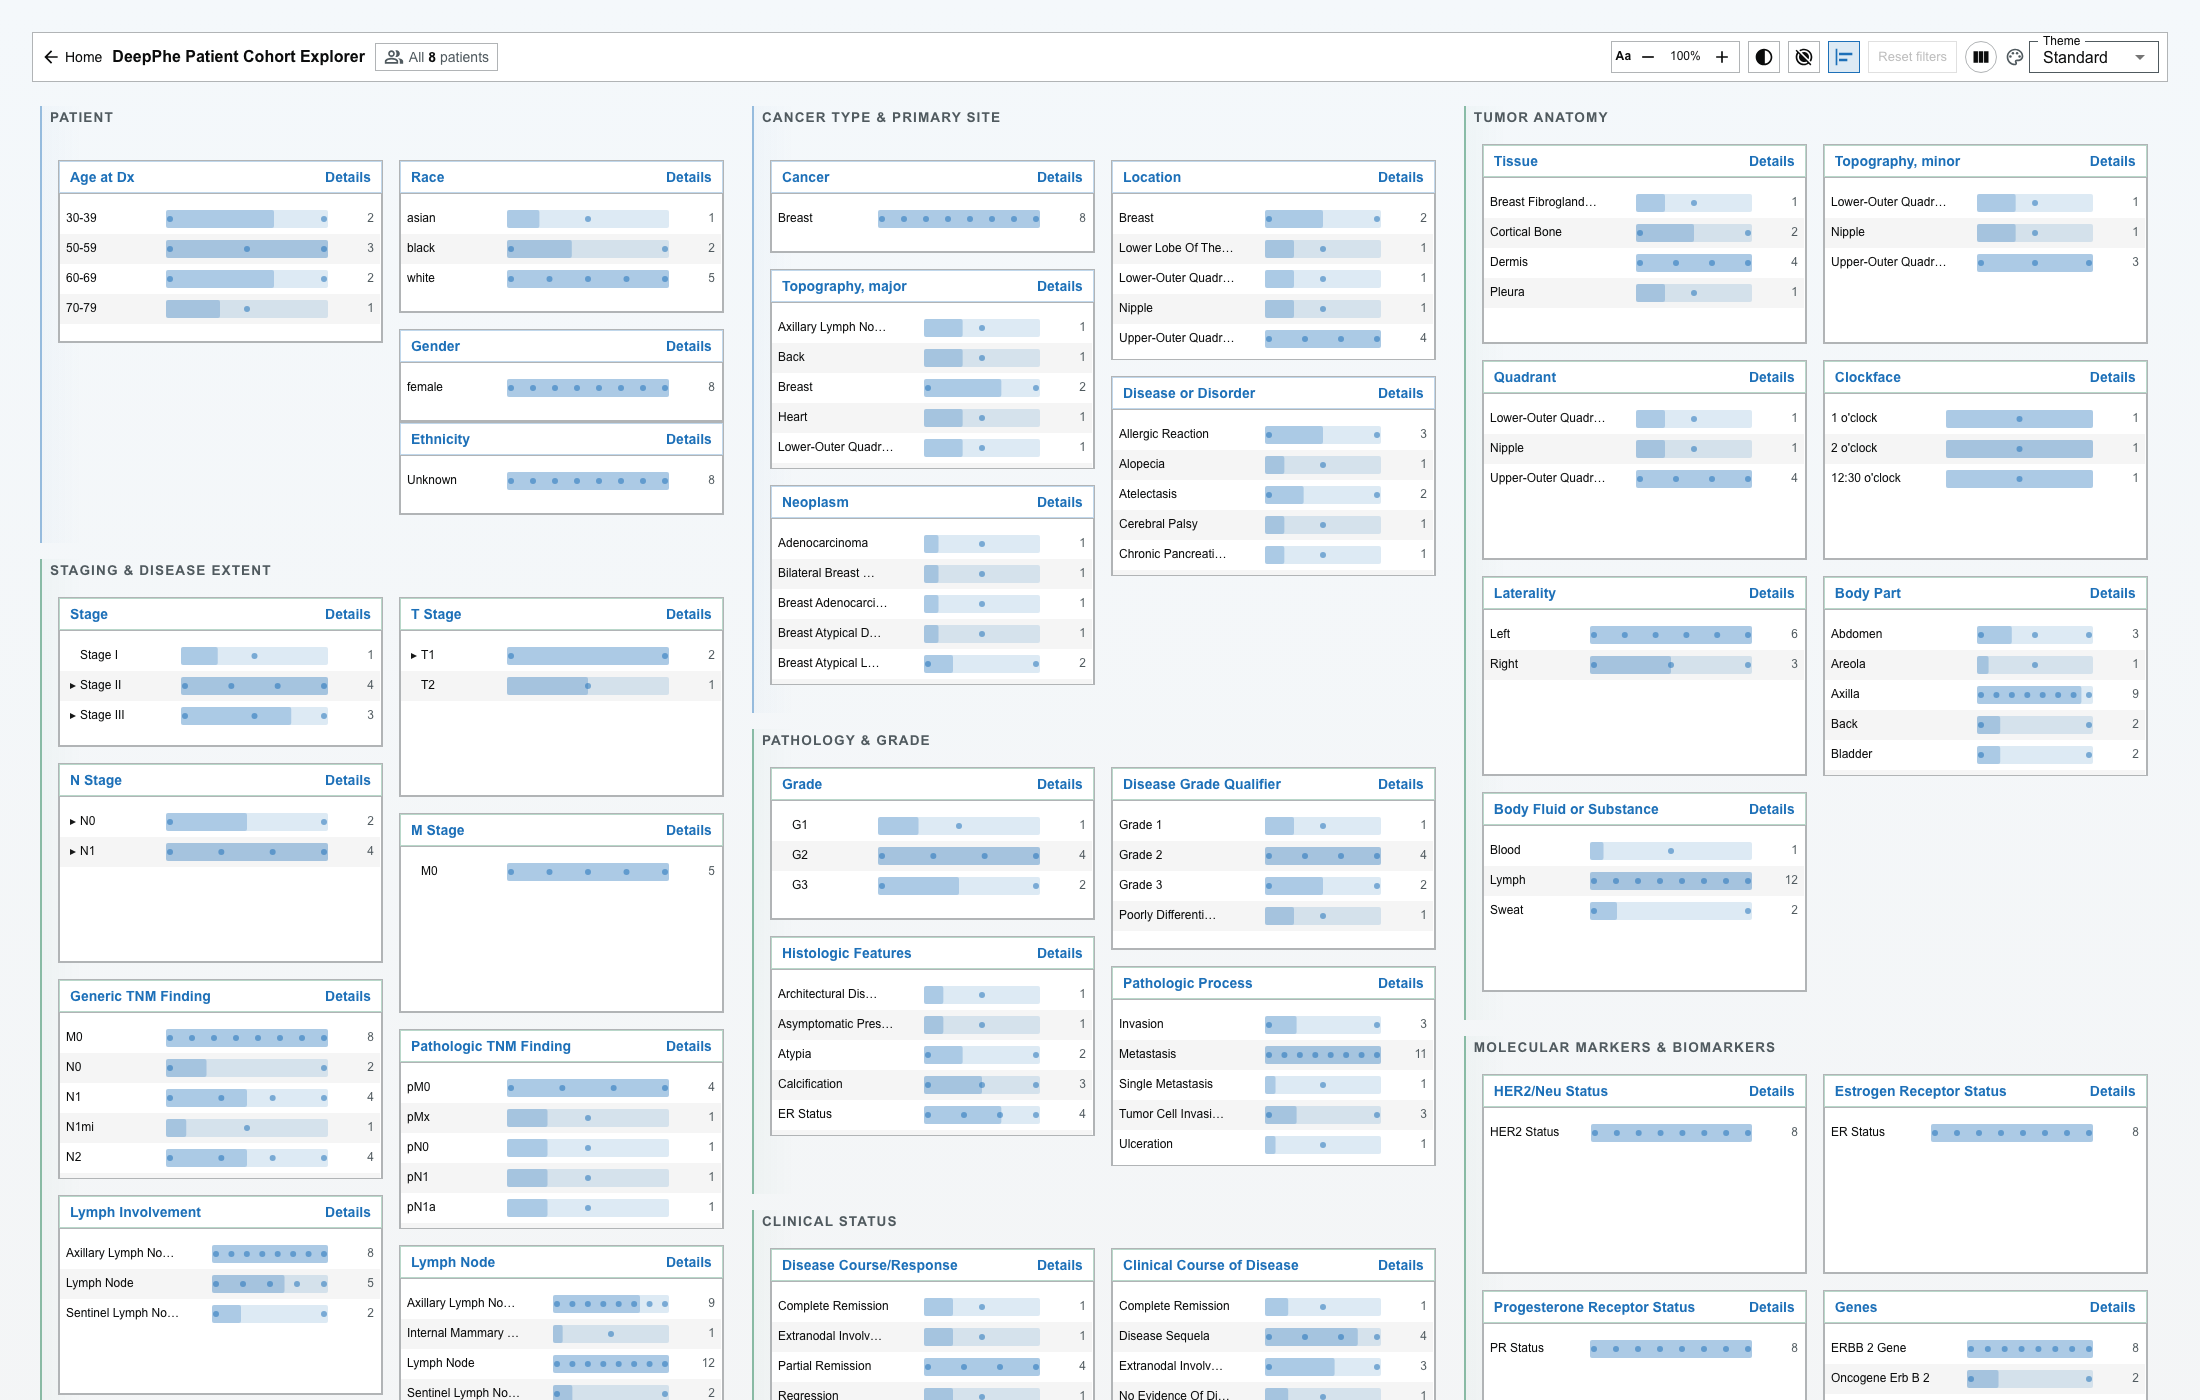
The DeepPhe Patient Cohort Explorer presents each available patient characteristic as a filter card. Every card lists values with a bar and a patient count. Selecting values narrows the cohort, and a Selected Patients drawer shows who matches.
Main areas
- Page toolbar — the patient count, Home, display and accessibility controls, Reset filters, the layout toggle, and the Theme menu. See Screen overview and toolbar.
- Filter sections — related cards grouped under headings such as Patient, Cancer Type & Primary Site, Staging & Disease Extent, and Treatment & Interventions.
- Filter cards — selectable values, each with a bar and a patient count.
- Selected Patients drawer — the matching cohort and patient-level detail. It appears once you make a selection (or open a patient from a filter bar).
How filtering works
- Values selected in the same card are alternatives — selecting
Stage IIandStage IIIincludes patients matching either. - Selections in different cards combine — selecting
Stage IIIandFemalerequires both. - As the cohort changes, the toolbar count and the counts inside other cards update.
- A value that can no longer add any matching patient is disabled. See Select and combine filters.
The exact cards depend on the data returned by the configured DeepPhe services.
Recommended workflow
- Start with a broad characteristic, such as cancer type.
- Add staging, pathology, biomarker, or treatment criteria.
- Watch the matching count after each selection.
- Review patients in the Selected Patients drawer.
- Open individual patients for source-level review, or export the loaded page.
note
Display and accessibility settings — such as theme, font size, and high contrast — change how the screen looks but never change your filters or the cohort.