Compare Responders and Progressors
Comparing subgroups is a core reason researchers reach for a tool like this. The HER2-targeted therapy workflow built one cohort; this one builds two and holds them up against each other:
Some tumors responded completely to treatment. Others kept growing. What separates the two groups?
You will define each group in turn and read the difference directly off the cards — no export, no statistics package, just the repaint. Allow about 10 minutes.
Before you start
Written against the bundled synthetic demonstration dataset of 500 breast cancer patients. Counts below come from that dataset; they will differ on other data but the method is the same — see Adapt this to your own data.
These records are generated. Study how the Visualizer represents the groups, not the specific fabricated values.
Start unfiltered — Reset filters so the toolbar reads All 500 patients.
Step 1 — Define the responders
Scroll to the Clinical Course of Disease card and select Pathologic Complete Response — patients whose tumor was gone at surgery after treatment, the best outcome on offer.
The cohort settles at 33 patients. Open the Stage card's Details dialog.
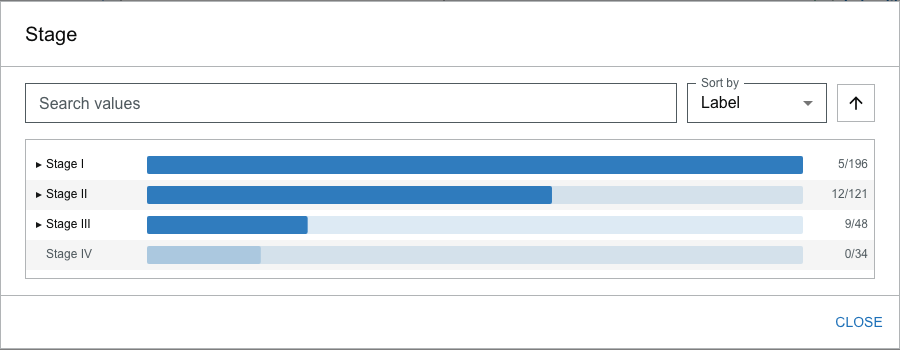
What you see. Stage I 5/196, Stage II 12/121, Stage III 9/48 — and Stage IV dimmed at 0/34. The Stage IV row is greyed and cannot be selected.
Why this matters. That dimmed row is the Visualizer telling you something with an absence. A value goes disabled when no patient in the current cohort carries it — selecting it could only ever produce zero, so the interface takes it off the table (see Values that can't add anyone are disabled). Here it means the clinical headline outright: not one complete responder was stage IV. You did not have to run a query to learn that — a whole stage simply went dark.
Step 2 — Read the rest of the responders' profile
Without changing the selection, look at the Metastatic Behavior card.

What you see. Metastatic reads 1/30 — a single responder shows metastatic behavior. The Grade card, meanwhile, is spread evenly across G1 (6), G2 (8), and G3 (8).
Why this matters. The picture is internally consistent: the group that responded completely is early-stage and almost never metastatic. Note what you are not doing — you are not cross-tabulating outcome against stage, then outcome against metastasis, then outcome against grade as three separate queries. You defined the group once and every card now describes it at a glance. That is the cohort-comparison workflow: characterize a group by reading its repaint, not by asking one question at a time.
Step 3 — Define the progressors
Reset filters, then, on the same Clinical Course of Disease card, select Progressive Disease — patients whose disease advanced despite treatment.
This cohort settles at 29 patients. Open the Stage dialog again.
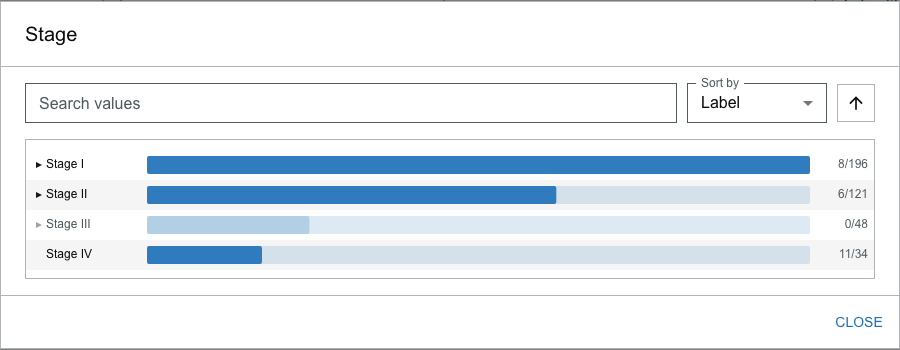
What you see. A different shape entirely. Stage IV is present and solid at 11/34 — the largest single stage in this group. This time it is Stage III that is dimmed at 0/48.
Why this matters. Set this dialog beside the one from Step 1 and the contrast is the whole exercise. For responders, stage IV was the impossible value; for progressors, it is the dominant one. The same disabled-value mechanism now points the opposite way, and eleven of twenty-nine progressors carry the stage that not one responder did. The interface has drawn the line between good and bad outcomes for you, in the position of a single dimmed bar.
Step 4 — Confirm the pattern holds
Look at the progressors' Metastatic Behavior card.

What you see. Metastatic reads 10/30, against the responders' 1/30. And the Grade card has shifted toward the high end — G3 (12) now outweighs G1 (3).
Why this matters. Every card tells the same story the stage dialog did: the group that progressed is later-stage, far more often metastatic, and higher-grade. When independent variables all move together like this, you are looking at a real signal in the cohort rather than an artifact of one facet. Reading three cards took you seconds, and you never left the screen.
The Pathologic Complete Response bar reads 36 but the cohort settled at 33; Progressive Disease reads 30 but gives 29. The number on a facet bar counts extracted mentions of the concept, and one patient can carry a concept in more than one place. The drawer and the toolbar count distinct patients. When you cite a cohort size, use the toolbar's count. See Understand cohort results.
What this exercise demonstrated
| Step | Capability | The reason it matters |
|---|---|---|
| 1 | A disabled value marks an empty intersection | A whole stage going dark states a finding without a query |
| 2 | One selection characterizes a group across every card | Compare subgroups by reading the repaint, not one cross-tab at a time |
| 3 | The disabled value points the other way for the other group | The contrast between two cohorts is legible in a single dimmed bar |
| 4 | Independent facets move together | Concordant shifts across cards signal a real pattern, not a facet artifact |
| 4 | Bar count (mentions) ≠ cohort count (patients) | Cite the toolbar's distinct-patient count when you report a cohort size |
Adapt this to your own data
The comparison method transfers to any pair of contrasting groups:
- Pick two opposing values of the same clinical axis — responders vs. progressors, recurrent vs. disease-free, one biomarker status vs. another.
- Select the first, read three or four cards, then reset and select the second. Keep the same cards in view both times so the differences are easy to spot.
- Watch for disabled values. A value that is available for one group and dimmed for the other is a difference the interface has already found for you.
- Trust concordance, distrust a lone signal. When stage, grade, and metastatic behavior all shift the same way, the pattern is robust; a difference on a single facet may be an extraction artifact. Confirm anything decision-relevant against the source records.
Presenting this as a demonstration
The exercise compresses to about four minutes:
| Time | Section |
|---|---|
| 0:00–0:30 | Premise and the synthetic-data caveat |
| 0:30–1:45 | Step 1–2 — responders: Stage IV dimmed, metastatic 1/30 |
| 1:45–3:15 | Step 3–4 — progressors: Stage IV 11/34, metastatic 10/30 |
| 3:15–4:00 | Put the two Stage dialogs side by side and close on the contrast |
The single strongest beat is opening the two Stage dialogs back to back — the dimmed bar jumps from Stage IV to Stage III between them. Keep Reset filters in reach for the switch.
Next steps
- Build a HER2-Targeted Therapy Cohort — the companion cohort-building workflow
- Select and combine filters — how and why values become disabled
- Understand cohort results — counts, mentions vs. patients, and empty results
- Filter Details dialog — the full value list behind each card